 English
 Português
Observability is the ability to understand what is happening inside a system from the data it emits, without changing the code every time a new question comes up. For corporate IT, that means finding the cause of a failure in minutes, not after hours of messages between teams.
Anyone who runs applications in production knows the scene: the customer reports the problem before the alert fires, a dashboard shows that something is slow but not where, and the investigation depends on whoever is on call. This guide is for IT managers, platform leads, and CTOs who want to change that. It covers what to instrument first, which alerts to keep, how to measure resolution time without being misled by the metric, and what to require from a software factory or a support team. For the delivery practices that sit around it, see DevOps Best Practices for Your IT Team.
What is observability?
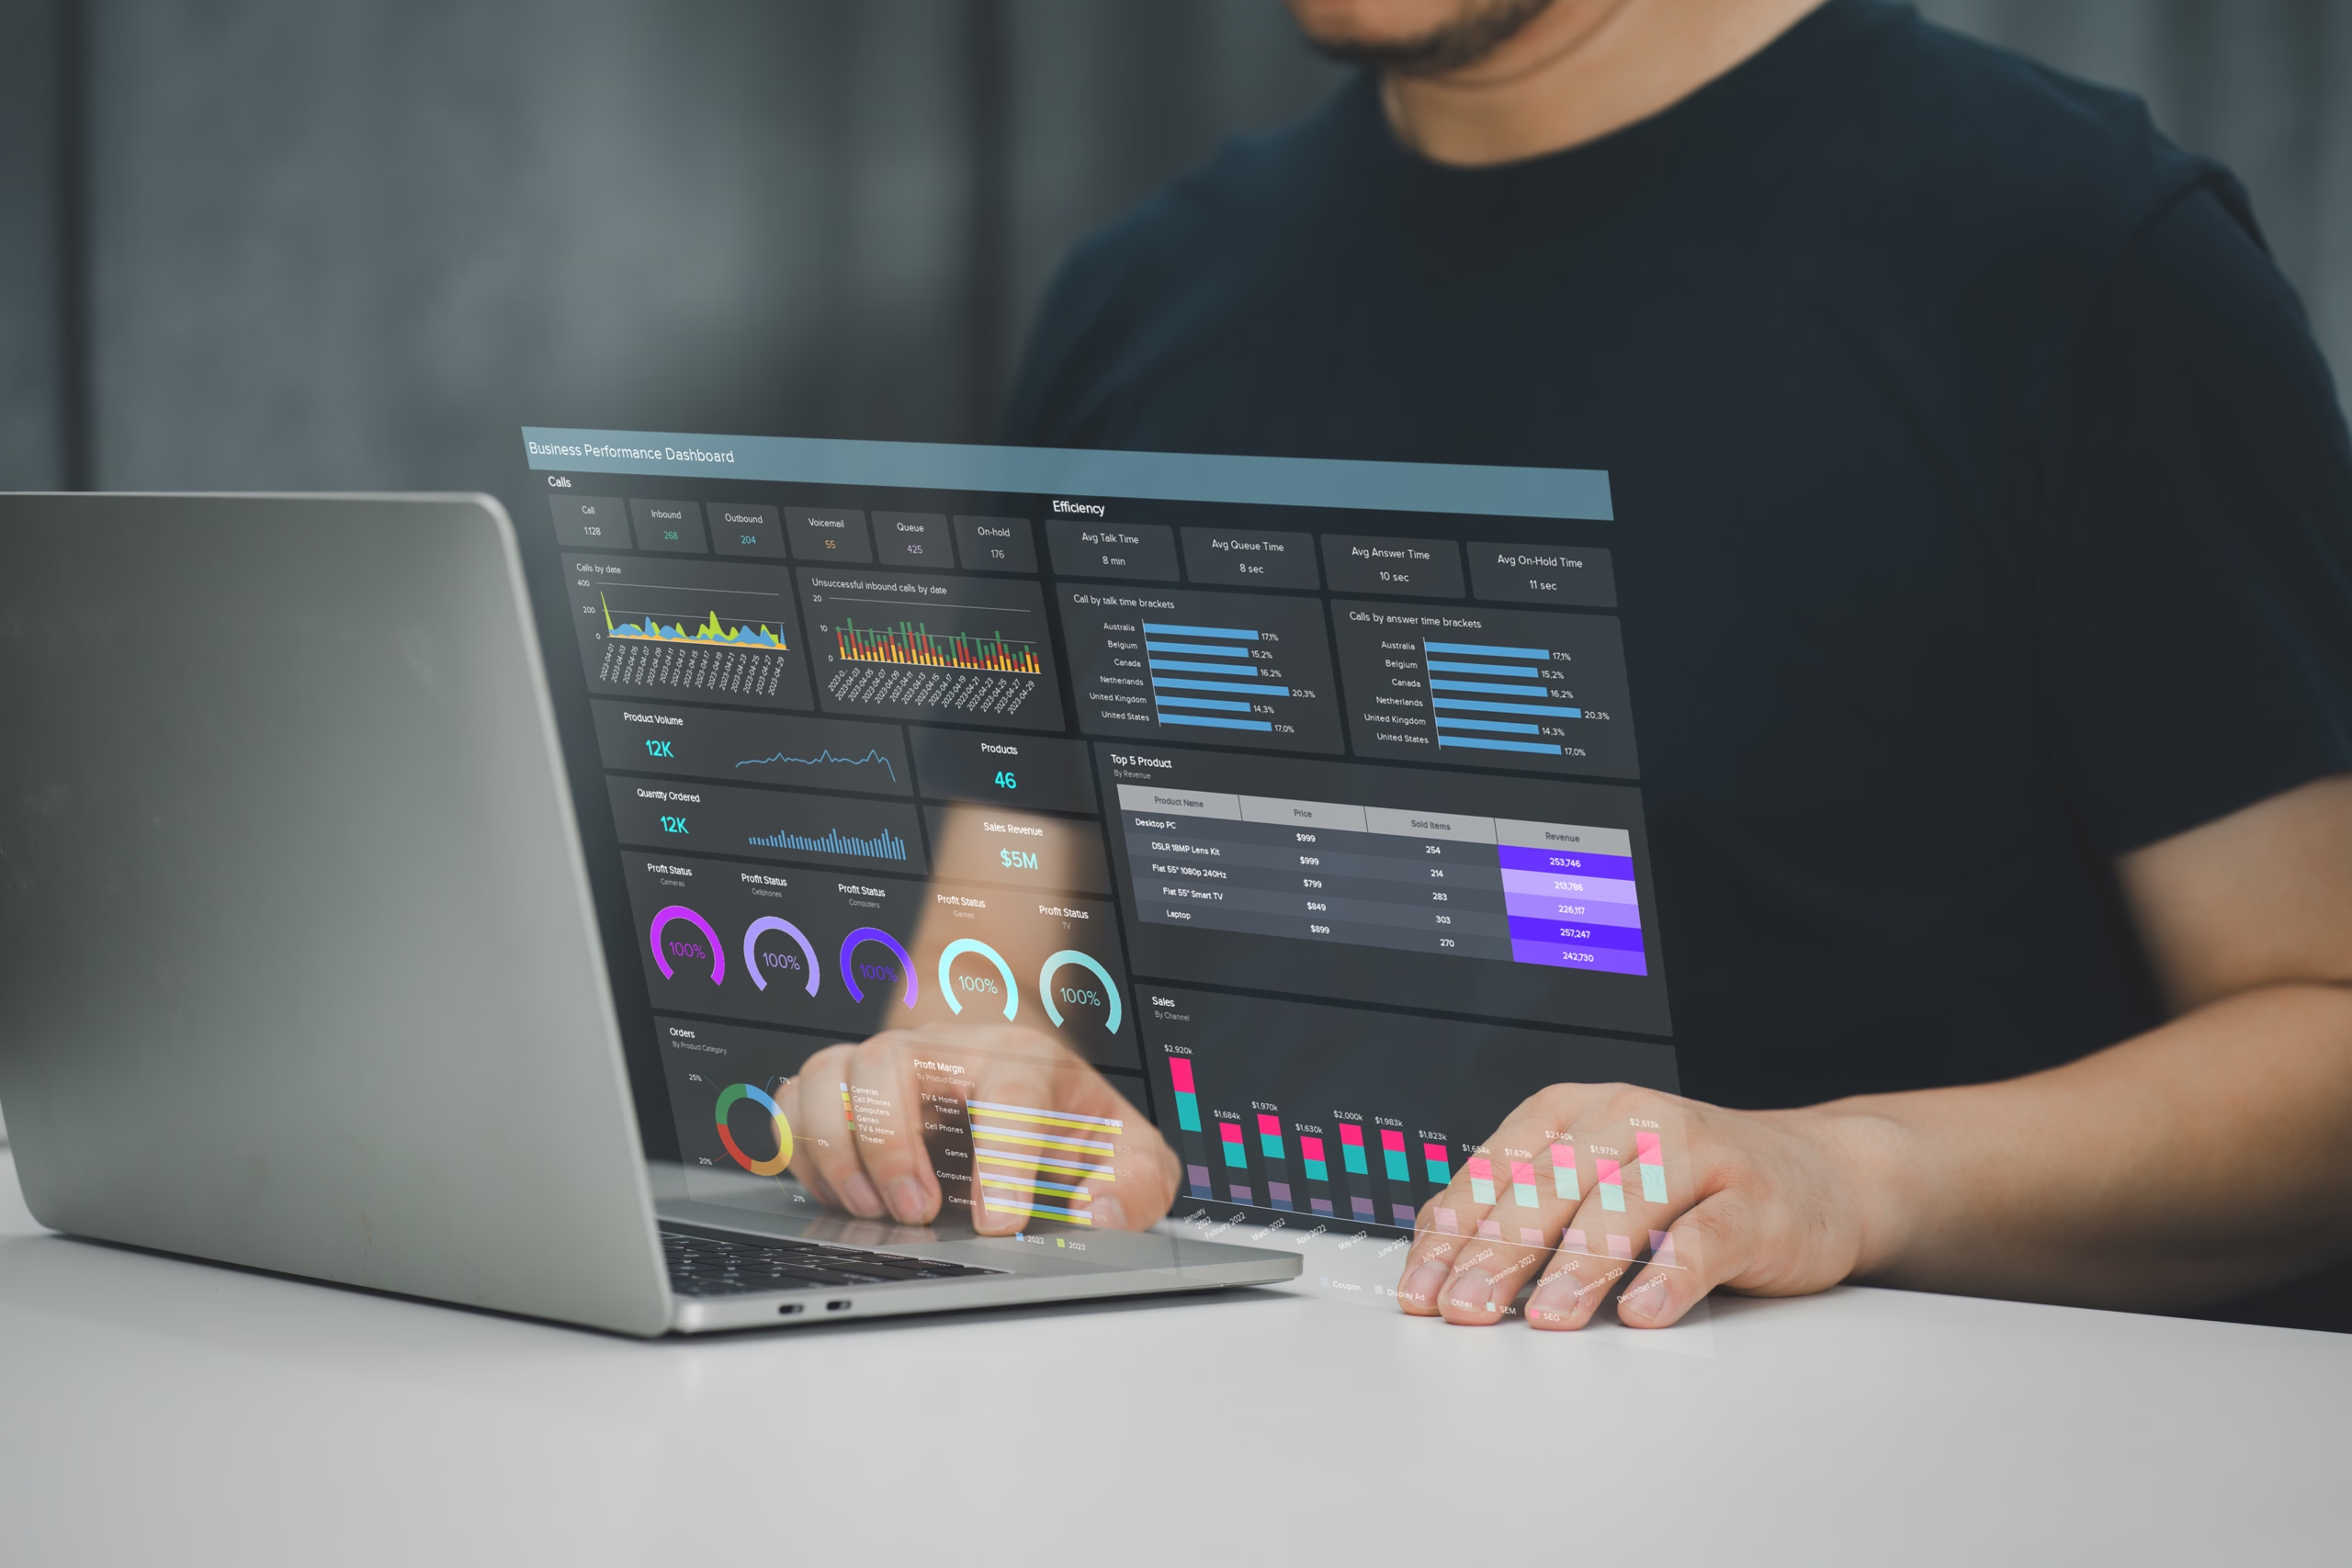
Observability is the ability to understand what is happening inside a system from the data it emits (logs, metrics, and traces), without changing the code to answer each new question. In practice, it lets an IT team find the cause of a failure quickly, including problems nobody anticipated.
The OpenTelemetry documentation, the reference open project, describes the idea in similar terms: understanding a system from the outside by asking questions about it, without knowing how it works inside. For that, the application must be instrumented, meaning it must emit the right signals.
The three types of data, also called pillars:
- Logs: records of events, with the detail of what happened at one point in the system.
- Metrics: numbers aggregated over time, such as error rate or CPU use.
- Traces: the path of a request as it crosses several services, with the time spent at each step.
Observability vs. monitoring: what is the difference
Monitoring tells you that something is wrong, based on metrics and thresholds defined in advance. Observability helps you discover why it is wrong, including in unexpected failures, by correlating logs, metrics, and traces. The two complement each other: monitoring without observability produces alerts without context; observability without monitoring warns nobody in time.
The table below summarizes the difference (an editorial synthesis by NextAge).
| Criterion | Monitoring | Observability |
|---|---|---|
| Question it answers | Is the system healthy? | Why is the system behaving this way? |
| Type of failure | Known, anticipated in an alert | Known and unexpected |
| Data | Metrics and thresholds defined in advance | Correlated logs, metrics, and traces |
| Main use | Detect and notify | Diagnose and learn |
| Result | An alert | Probable cause, with context |
Signs your operation is still reactive
If three or more of the items below describe your routine, the problem is not a lack of dashboards: it is method.
- The customer or the business area reports the incident before IT does.
- There are too many alerts, and some are silenced out of habit.
- Alerts arrive with no owner and no instructions on what to do.
- The investigation depends on one or two people who “know the system”.
- To find the cause, the team opens several separate dashboards and log files.
- After the incident, no action is recorded, and the problem returns months later.
Keeping this picture can be expensive. According to the 2025 Observability Forecast by New Relic, high-impact outages carry a median cost of US$ 2 million per hour (about US$ 33,000 per minute), and the median drops to US$ 1 million per hour among organizations with full-stack observability. This is a study from a tool vendor, with a global sample and figures in dollars: use the number as an order of magnitude, not as a projection for your company.
What to instrument first
Start with the services that most affect the customer and with four signals: latency, traffic, errors, and saturation. These “golden signals” appear in the monitoring chapter of the Google SRE book and cover the health of any user-facing service. Then add traces, to follow a request across services, and structured logs, for detail.
The table shows a hypothetical example: a payments API.
| Signal | Question | Example |
|---|---|---|
| Latency | How long does the service take to respond? | Response time of the payment authorization (95th percentile) |
| Traffic | How much demand does the service receive? | Requests per second |
| Errors | How many requests fail? | Rate of server errors and timeout declines |
| Saturation | How close to its limit is the service? | CPU, memory, database connections, and queues |
In legacy systems, the starting point is usually more modest: structured logs and metrics at the system’s entry and exit points. If the lack of visibility comes from an old architecture, see also Legacy System Modernization: Choose Between Rehost, Refactor, Rearchitect, and Rewrite.
Alerts worth waking someone up for
A good alert describes a symptom the user feels (checkout is slow), not a possible cause (CPU is at 85%). The same chapter of the Google SRE book separates the two questions: what is broken, and why. The first raises the alert; the second lives in diagnostic dashboards and observability data.

A practical way to define “symptom” is to use SLIs and SLOs:
- SLI (service level indicator): the measure, such as the share of requests served in under 500 ms.
- SLO (service level objective): the target for that indicator, such as 99.5% over 30 days (illustrative values).
Alerting when the SLO is at risk cuts noise, because the team is called only when customers are actually affected.
Noise has a cost. In the 4th annual survey by Grafana Labs (March 2026, with more than 1,300 responses from 76 countries), alert fatigue is the biggest obstacle to responding quickly to incidents: 30% of respondents, nearly double the second most common answer. The survey comes from a tool vendor, and respondents were reached through the company’s own channels.
Practical rules (a NextAge editorial proposal):
- Every alert has an owner and a response guide (runbook).
- An alert nobody acts on is removed or downgraded to a dashboard.
- Alerts are reviewed every month, based on which ones woke someone up unnecessarily.
How to measure resolution time
Resolution time breaks down into detecting, acknowledging, and recovering. Measuring each stage shows where the delay is: if detection is slow, the issue is monitoring; if diagnosis is slow, it is observability; if the fix is slow, it is process and architecture.
The most common acronyms:
- MTTD (mean time to detect): from the start of the problem until someone is notified.
- MTTA (mean time to acknowledge): from the alert until a person takes ownership of the incident.
- MTTR (mean time to resolve or recover): from the start of the problem until the service is back to normal. The acronym has more than one meaning in the industry, so define yours before tracking it.
Use the metric with care. The VOID report, from Verica, gathers incidents published by companies. According to InfoQ’s analysis, it found no relationship between an incident’s duration and its severity, and concluded that average-based measures can mislead, because durations are skewed (a few very long incidents distort the result). The report is from 2022, comes from a chaos engineering company, and relies on public data, which tends to come from teams that publish post-mortems.
In practice (an editorial proposal): track the median and the 90th percentile by severity, together with customer impact and SLO consumption, instead of a single average.
Do not confuse this measure with the DORA one. In 2023, DORA renamed the old MTTR as failed deployment recovery time, restricted to failures caused by changes in production, as described in the history of DORA metrics. Infrastructure, third-party, and network incidents fall outside that metric, so keep the two separate in your reports. For the broader set of delivery metrics, see DORA Metrics: Indicators to Measure Your IT Team’s Maturity.
Observability tools: how to choose
Choose tools by criteria, not by brand. The main ones (a NextAge editorial proposal):
- Open instrumentation standard: reduces the risk of vendor lock-in.
- Cost of data volume: logs and traces grow fast; ask for a simulation with your volume.
- Correlation: the tool should let you go from a metric to a trace and then to the log of the same request.
- Integration: with what already exists (cloud, CI/CD, ticketing, communication).
- Operating effort: the best set is the one your team can maintain.
A common path is to instrument with OpenTelemetry, an open standard, and choose later where the data goes. That way, switching platforms does not require rewriting the instrumentation. The market has commercial platforms (such as Datadog, New Relic, and Elastic) and open solutions (such as Prometheus and Grafana); the list gives examples, in no order of preference.
On artificial intelligence: according to Grafana Labs, in a 2025 survey of 150 IT decision-makers, only 3% used AI for observability in production, and more than 80% were exploring or piloting it. The sample is small and comes from a vendor. Treat these features as diagnostic support, after the telemetry base is organized. For the broader picture of AI in IT, see What Will Change with Generative AI by 2027: A Guide for IT.
A four-phase adoption roadmap
This is an editorial proposal, with no guaranteed timelines: the pace depends on the size of the environment and the team’s maturity.
- Choose what matters. Define 3 to 5 critical services, one SLO for each, and an owner. In projects run by a software factory, this phase fits in discovery, when it is simpler to record requirements like these.
- Instrument. Cover the four signals and structured logs in those services, with a correlation identifier (trace ID) in every request.
- Alert on symptoms. Create SLO-based alerts, each with an owner and a runbook, and remove those that do not call for action.
- Measure and learn. Track MTTD, MTTA, and MTTR by severity (median and 90th percentile), run a review after each serious incident, record the actions, and expand to new services.
What to require from a software factory or a support team
When you hire development or support, observability should be part of the scope and the acceptance criteria, not requested only after the first incident. Checklist for the contract and the acceptance meeting (a NextAge editorial proposal):
- Observability requirements and service level objectives recorded at the start of the project.
- Structured logs, with a correlation identifier per request.
- Metrics for the four signals for each critical service.
- Traces for flows that cross more than one service.
- Symptom-based alerts, each with an owner and a runbook.
- Health and diagnostic dashboards delivered with the software.
- Instrumentation on an open standard (such as OpenTelemetry), with the configuration kept in the client’s repository.
- Deliveries that include testing the alerts (simulating a failure and checking that the warning arrives).
- A periodic incident report: MTTD, MTTA, and MTTR by severity, with post-incident actions.
- Runbooks, dashboards, and access documented and owned by the client.
At the NextAge Software Factory, the company takes responsibility for delivery: the client defines the business goal, and a full team handles the lifecycle, from discovery (which maps goals, integrations, and risks) to deployment and support, with monitoring and documentation. These stages are where the checklist above applies: observability requirements enter discovery, instrumentation is designed in the architecture, alerts are validated in the biweekly deliveries, and runbooks ship with the documentation, which belongs to the client.
To see how the process works, read Software Development Stages in a Software Factory; to understand the model, read Software Factory: What It Is and Why Your Company Should Hire One.
Frequently asked questions
What is observability?
It is the ability to understand what is happening inside a system from the data it emits (logs, metrics, and traces), without changing the code to answer each new question. It lets teams find the cause of failures quickly, including unexpected problems.
What is the difference between monitoring and observability?
Monitoring tells you that something is wrong, based on metrics and thresholds defined in advance. Observability helps you discover why it is wrong, by correlating logs, metrics, and traces, including in failures nobody anticipated. The two complement each other: one detects, the other explains.
What are the pillars of observability?
The three most cited are logs (records of events), metrics (numbers aggregated over time), and traces (the path of a request across services). Some vendors suggest a fourth signal, profiling (an execution profile). The value lies in correlating the data, not in collecting it in isolation.
What is MTTR and how can you reduce it?
MTTR is the mean time to resolve (or recover from) an incident. To reduce it, detect earlier with symptom-based alerts, diagnose with correlated data, keep runbooks up to date, and record actions after each incident. Track the median and the 90th percentile, because the average can mislead.
Where should you start implementing observability?
Choose 3 to 5 critical services, define one SLO for each, and instrument the four signals (latency, traffic, errors, and saturation) with structured logs. Then create symptom-based alerts with an owner and a runbook, and only after that expand to the rest of the environment.
How do you choose observability tools?
Compare them by criteria: open instrumentation standard, cost of data volume, ability to correlate logs, metrics, and traces, integration with the current environment, and operating effort. Instrumenting with OpenTelemetry reduces the risk of vendor dependence and makes it easier to switch platforms.
What should you require from a software vendor regarding observability?
Require observability requirements at the start of the project, structured logs, metrics for the four signals, alerts with an owner and a runbook, dashboards delivered with the software, instrumentation on an open standard, and a periodic incident report. Runbooks and configurations should be documented and owned by the client.
Conclusion: three next steps
Observability works when it is treated as a delivery requirement, with clear criteria and measurement. Three actions are worth taking this week:
- List 3 to 5 critical services and define one SLO for each.
- Review current alerts: keep only those that call for action, each with an owner and a runbook.
- Bring the checklist to your next acceptance or contract review meeting with the vendor or the in-house team.
Want a team that takes ownership of delivery, with quality validated in every sprint? Talk to a NextAge specialist.