English
  Português
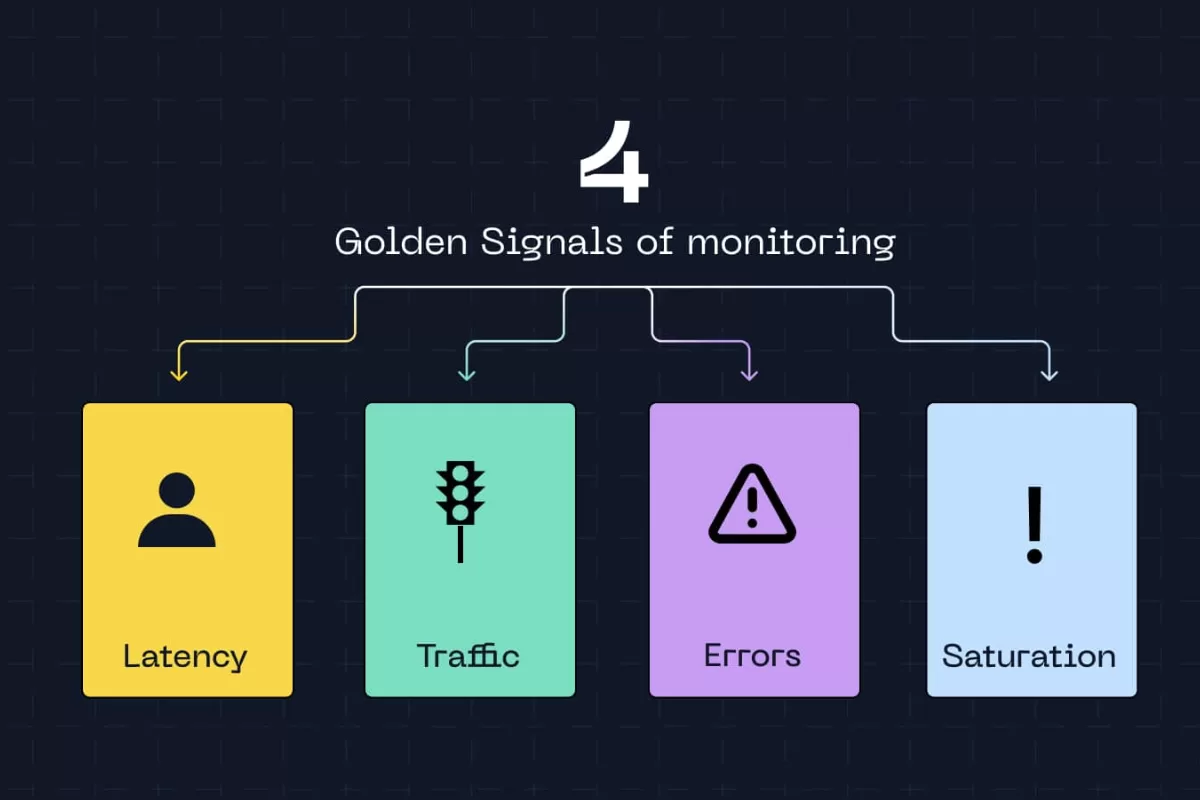
The Golden Signals were conceived by Google’s SRE (Site Reliability Engineering) team and revolutionized how technology professionals approach monitoring.
They are four fundamental metrics: latency, traffic, errors, and saturation. Together, they provide a complete view of any system’s health without the need to track hundreds of indicators simultaneously.
According to research by Dimensional Research (2023), 94% of organizations that experienced critical downtime pointed out that late problem identification was the main reason for prolonged unavailability. With that in mind, we wrote this article. Let’s dive in?
What are Golden Signals?
Golden Signals are a set of four essential metrics to assess whether a system is functioning properly or heading toward failure. The term “golden” is no exaggeration, these metrics are valuable because, with just four indicators, you can detect most problems affecting modern applications and infrastructures.
Latency measures how long the system takes to respond to a request. From the moment a user clicks a button until they receive the response on screen, that interval is latency. It can be measured in milliseconds, seconds, or even minutes, depending on the type of operation.
Traffic indicates the volume of requests the system is processing. It can be measured in requests per second, transactions per minute, or even GB of data transferred.
Errors count how many requests failed. This includes pages that didn’t load, transactions that weren’t completed, timeouts, and any unexpected system response. This metric is typically expressed as an error rate percentage.
Saturation shows how much of the available resources is being used. CPU at 90%, memory nearly full, disk with little free space, all of this indicates saturation. It’s the metric that reveals whether the system is close to its limit before it starts to fail.
How each Golden Signal works in practice
Latency
Latency is probably the most noticeable metric for end users. When a page takes too long to load or an app freezes, we’re experiencing high latency firsthand. For IT systems, latency encompasses API response time, database queries, request processing, and inter-service communication.
Effective latency monitoring goes beyond calculating a simple average. Mature teams work with percentiles, especially the 95th percentile (p95) and 99th percentile (p99). Why? Because averages hide problems. If 95% of requests respond in 200ms and 5% take 10 seconds, the average may seem acceptable while thousands of users face unbearable slowness.
A study by Akamai (2017) revealed that a delay of just 100 milliseconds in loading time can reduce conversion rates by 7%.
Monitoring latency also helps create realistic SLOs (Service Level Objectives). Instead of promising a “fast system,” you can commit to “95% of requests responded to in less than 300ms.”

Traffic
Traffic measures the demand on your system. For an API, this means requests per second. For a website, it might be pageviews per minute. For a data processing service, perhaps it’s the number of jobs executed per hour. Regardless of the unit, traffic reveals whether your system is busy, idle, or experiencing abnormal spikes.
A sudden drop in traffic can be just as problematic as a spike. Imagine your system normally processes 5,000 requests per minute and suddenly that number drops to 500. This could indicate something is preventing users from accessing the service, perhaps a load balancer failure, DNS issue, or even a DDoS attack that left part of the infrastructure inaccessible.
According to a Gartner report, the average cost of downtime for companies is $5,600 per minute. For organizations that depend on digital systems, every second of unavailability is expensive. Traffic also feeds capacity planning decisions. If you notice consistent growth of 20% per month, you know you need to scale resources before saturation becomes a problem.
Errors
Error rate is perhaps the most straightforward metric for measuring a system’s health. Errors can take many forms: HTTP 500 (internal server error), 404 (resource not found), timeouts, unhandled exceptions in code, or integration failures with external services.
Not all errors carry the same weight. A user who typed a wrong URL and received a 404 is different from a thousand customers trying to complete purchases and receiving error 500 because the payment system crashed. That’s why effective error monitoring separates failures by type and severity.
A common approach is to define error budgets, how much error is acceptable. No complex system will have zero errors all the time, so establishing that “error rate should stay below 0.1%” is more realistic than seeking absolute perfection. When this threshold is exceeded, alerts and investigations are triggered.
The correlation between errors and other metrics also brings valuable insights. If the error rate increases along with latency and CPU saturation, there’s probably a performance problem leading to timeouts. If errors rise while latency remains normal, it might be a recently introduced bug in the code.
Saturation
Saturation indicates how much of your available resources you’re using. CPU, memory, disk space, network bandwidth, database connections, everything has limits. When these resources approach 100% utilization, problems appear.
The particularity of saturation is that it functions as a predictive indicator. While latency, traffic, and errors show problems already happening, saturation warns that something bad is about to occur. It’s like seeing the fuel tank approaching empty before the car stops.
Saturation thresholds vary by resource. CPU at 70-80% already deserves attention, as momentary spikes can quickly take it to 100%. Memory above 85% is concerning because it can force the operating system to use swap, drastically degrading performance. Disk with less than 10% free space can prevent writing logs or critical data.
Monitoring saturation also reveals inefficiencies. If CPU remains consistently high with moderate traffic, there might be poorly optimized code consuming unnecessary processing. Memory growing constantly could indicate a memory leak. Database connections always at the limit suggest that pooling is misconfigured. According to research by New Relic (2021), 75% of organizations experience infrastructure-related performance issues at least once a month.
Implementing Golden Signals: from concept to practice
The process of implementing Golden Signals begins with proper instrumentation of code and infrastructure. Applications need to expose metrics that can be collected by monitoring tools. In practice, this means adding instrumentation libraries (such as Prometheus client libraries, OpenTelemetry, or APM tool SDKs) to the code.
For latency, you instrument entry and exit points of requests, measuring elapsed time. Modern web frameworks generally already include middlewares that do this automatically. For traffic, incoming requests are counted, typically through counters that increment with each call. Errors are captured through try-catch blocks and structured logging that classifies exceptions by type and severity.
Saturation requires access to operating system and runtime metrics. Tools like node_exporter (for Linux), cAdvisor (for containers), or language-specific SDKs expose CPU, memory, disk, and network usage. In cloud environments, providers like AWS, GCP, and Azure offer these metrics natively.
After collecting data, you need to store it in a time-series database (TSDB) system like Prometheus, InfluxDB, or managed solutions like Datadog and New Relic. These databases are optimized for large volumes of temporal data and fast queries over time intervals.
Visualization happens through dashboards. Grafana is a popular choice for creating custom panels that show Golden Signals in real time. The key is to avoid cluttered dashboards—create focused visualizations that highlight the four main signals.
Alerting is where metrics become actionable. Configure alerts based on thresholds: “warn when p95 latency > 1s for more than 5 minutes” or “trigger page when error rate > 2%”. Beware of alert fatigue—too many alerts desensitize the team.
Tools alone aren’t enough. Technical expertise makes the difference between having metrics and actually leveraging their value. Teams need to understand how to interpret data, correlate signals, and act quickly when problems appear.

NextAge and Quality Assurance
Golden Signals establish a foundation for monitoring, but a good development process requires experienced professionals who master all best practices.
At NextAge, our approach to system development and maintenance always incorporates observability as a fundamental requirement.
Our Quality Center combines QA specialists with Artificial Intelligence-powered automation to ensure problems are detected and resolved before reaching production. Dedicated squads work on technical and functional validation, using Golden Signals as part of the testing process. Latency is measured in load tests, errors are tracked in integration tests, saturation is monitored during stress testing.
In our own staff augmentation model, we allocate complete agile squads that bring a data culture embedded in their DNA. Technically and behaviorally validated professionals understand that delivering functionality is only half the job, as the other half is ensuring that functionality remains reliable over time.
Finally, our Software Management Services go beyond traditional corrective support. We act proactively using Golden Signals to identify problems before they become unavailability. We monitor increasing latency that indicates the need for optimization, track intermittent errors that could explode into larger failures, observe gradual saturation that signals it’s time to scale resources.
Want to talk about how we can build or maintain systems that generate value for your business? Get in touch and discover how to transform monitoring from reactive to proactive.